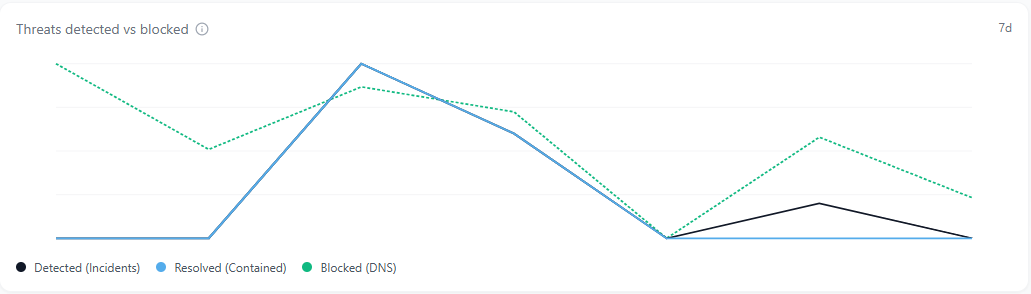
The Threats Detected vs Blocked chart appears in the center of the dashboard and visualizes daily trends in detected, resolved, and blocked threats over the last 7 days.
Overview
The Threats Detected vs Blocked chart shows how your network is performing across multiple layers of defense. It compares three metrics over time (Detected, Resolved, and Blocked) to reveal how effectively threats are being identified, contained, and prevented.
Each line in the chart represents a different stage of protection:
- Detected (black): Potential threats identified by the network monitoring system.
- Resolved (blue): Incidents that have been reviewed, contained, or closed by administrators.
- Blocked (green, dotted): DNS requests prevented from reaching known malicious or restricted domains.
Hovering over a data point displays daily totals for each category.
How It Works
Scout continuously aggregates threat and DNS data from all protected networks. The chart represents the rolling 7-day activity window and updates automatically.
- Detections represent alerts generated from traffic inspection and behavior analysis.
- Resolutions are recorded when incidents are marked as contained or resolved.
- Blocks occur when a domain request matches a known threat or policy rule and is stopped before the connection is made.
Together, these metrics show both preventive and reactive performance how well the system stops threats before impact and how quickly issues are handled when detected.
Why It Matters
This chart provides a high-level view of overall protection effectiveness. By comparing the three lines, administrators can quickly identify changes in threat volume, response speed, and filtering strength.
Common patterns to watch for:
- A rising Detected line without a matching increase in Blocked traffic may indicate new or unclassified threats.
- A consistently strong Blocked line suggests effective filtering and proactive protection.
- A wide gap between Detected and Resolved incidents can point to investigation delays or backlogs.
Monitoring these relationships helps teams maintain balance between detection accuracy, response efficiency, and preventive control.
Tips and Best Practices
- Review spikes in any category to understand the cause as they often correspond to phishing waves, malware attempts, or infrastructure scanning.
- If Blocked counts outpace Detected, your DNS filtering is performing well as a first line of defense.
- Use the Resolved trend to monitor operational workload and incident closure efficiency.
- Pair this chart with Active Incidents and Critical Incident Resolution for a complete view of detection-to-remediation performance.
The Threats Detected vs Blocked chart updates continuously and reflects data from all Scout services and connected devices within your organization.