The Incidents by Severity card appears on the right side of the dashboard and shows how many incidents occurred at each severity level during the selected time period.
Overview
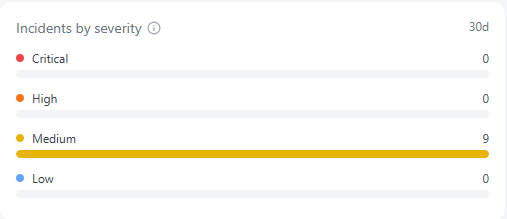
The Incidents by Severity card visually summarizes all security incidents detected within the current reporting window (usually 30 days). It displays the number of incidents by severity category (Critical, High, Medium, and Low) using color-coded bars that represent relative volume.
This card helps administrators quickly understand the distribution and frequency of events based on severity, making it easier to spot changes in risk level across time.
How It Works
Every incident detected by Scout includes a severity rating assigned automatically by detection logic or manually during analyst review. The Incidents by Severity card groups and totals these incidents across four categories:
- 🔴 Critical: Immediate, high-impact threats that require urgent containment.
- 🟠 High: Significant events that may escalate if not addressed promptly.
- 🟡 Medium: Moderate issues or policy violations with limited scope.
- 🔵 Low: Informational alerts or minor findings with minimal risk.
The severity with the highest count is displayed as a fully filled bar, while the others scale proportionally to represent relative frequency. Administrators can hover or drill down into each category for additional context on individual incidents.
Why It Matters
Understanding severity distribution helps assess your organization’s current risk posture and how effectively your controls are performing.
A surge in critical or high incidents may indicate an active threat campaign or a misconfiguration allowing unsafe behavior. A high count of medium or low events often signals good detection coverage and effective containment before escalation.
By tracking this metric, administrators can:
- Identify where risk is concentrated within the network
- Evaluate how threat levels change over time
- Prioritize response and resource allocation more effectively
Tips and Best Practices
- Review this card weekly to identify shifts in severity distribution.
- Combine it with Critical Incident Resolution and Average Response Time (MTTR) to measure both volume and response efficiency.
- Investigate unexpected increases in critical or high events to verify configuration integrity and rule accuracy.
- Validate that incidents are being categorized correctly and not left unresolved under generic labels.
The Incidents by Severity card updates automatically and reflects incident data collected from all Scout-monitored devices within the selected timeframe.